

This is one in a series of briefs prepared as part of C2ES’s Climate Innovation 2050 initiative, which brings together leading companies to examine potential pathways toward substantially decarbonizing the U.S. economy. Other briefs focus on Agriculture & Forestry, Buildings, Oil & Gas, Manufacturing, and Power Generation. (Note: Full citations to supporting materials can be found in the pdf version of this brief.)
This brief provides an overview of emissions trends and projections, and of decarbonization challenges and opportunities, in the U.S. transportation sector. Key points include:
The transportation sector moves goods and people across the United States via road, rail, ship, and airplane. It employs nearly 10 million people, and accounted for 8.9 percent of U.S. GDP in 2015. Petroleum supplies more than 90 percent of the sector’s energy, and essentially all of its greenhouse gas emissions come from the combustion of gasoline, diesel, jet fuel, or other petroleum liquids. Other energy sources like natural gas, ethanol, biofuels, hydrogen, and electricity comprise small fractions of today’s transportation energy supply.
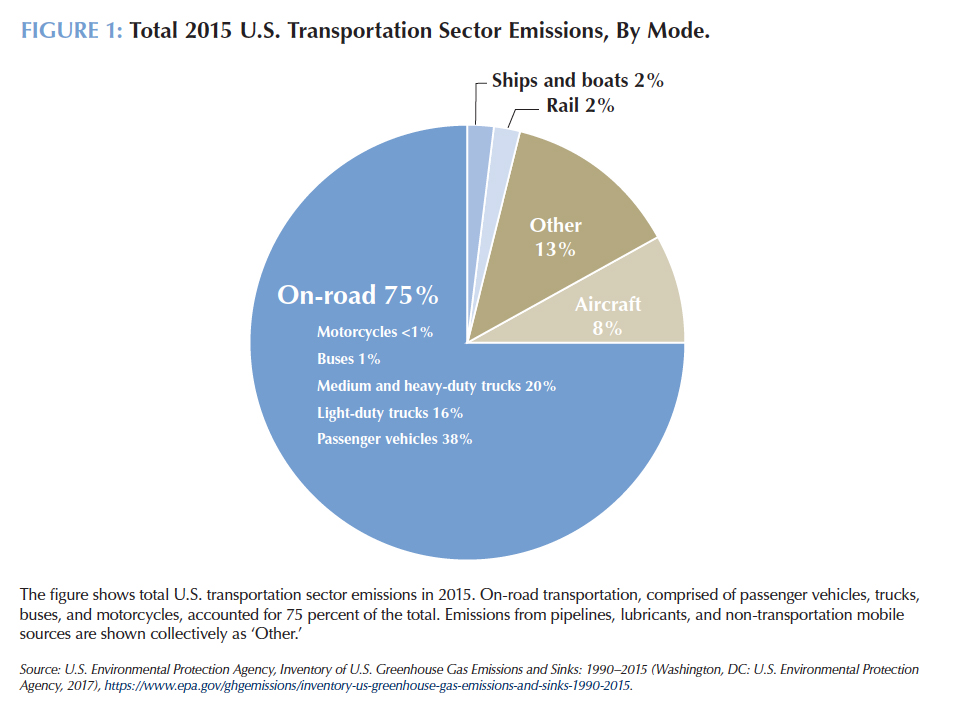
The subsector producing, by far, the greatest emissions is on-road transportation, which includes passenger cars, light-duty trucks (e.g., vans and SUVs), medium- and heavy-duty trucks, buses, and motorcycles (Figure 1). However, emissions from aviation grew more rapidly in 2017 than any other subsector, offsetting roughly 40 percent of the decline in emissions from coal use in electric power generation for the year.
Transportation “output” tends to be measured in usage: vehicle miles traveled (VMT) for cars and trucks, passenger miles travelled for transit, airplanes, and other passenger vehicles, and ton miles for freight. This metric reflects total activity in the transportation sector and directly relates to sector emissions.

As of 2016, transportation is the United States’ largest direct source of greenhouse gases (industry ranks higher when counting both its direct and indirect emissions). Most transportation emissions are carbon dioxide (CO2) produced by the combustion of fossil fuels. Methane and nitrous oxide are also emitted as by-products of combustion. Cooling systems, which are commonly used for both air conditioning and refrigerated transport of goods, also emit hydrofluorocarbons (HFCs).
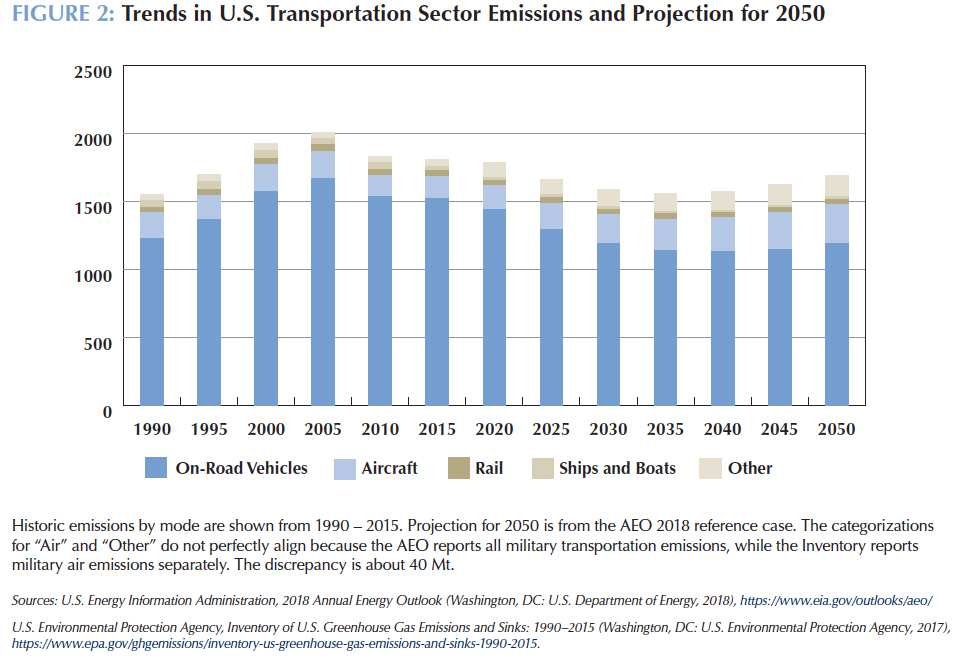
Total transportation sector emissions rose 29 percent from 1990 to 2005, driven largely by VMT increases in road transport. With continued improvements in vehicle efficiency, sector emissions fell 9.7 percent from their 2005 peak by 2015. In recent years, sector emissions have been increasing, due largely to increased passenger-vehicle VMT. Having averaged 2.3 percent a year from 1990 to 2005, and then slowing to less than 1 percent a year, VMT growth rebounded to 2.3 percent in 2015 and grew to 3.6 percent in 2016. Another key driver of emissions trends is the increased market share of less fuel-efficient light trucks, up from 20 percent in model years 1975–1982 to 45 percent in 2016.
Other subsectors have shown mixed trends. Medium- and heavy-duty trucks experienced a 95 percent increase in VMT between 1990 and 2015, leading to a 78 percent increase in CO2 emissions. CO2 emissions from domestic aviation increased by 8 percent over the same period, while emissions from international flights leaving the U.S. increased by 88.8 percent. By contrast, CO2 emissions from international shipping from the U.S. have decreased 40.6 percent since 1990.
The Energy Information Agency’s 2018 Annual Energy Outlook (AEO) projects a 13.6 percent reduction in total transportation sector CO2 emissions, including indirect emissions from electricity used in transportation, between 2015 and 2035. Steadily rising usage in all modes is outweighed by the improving efficiency of on-road vehicles, resulting in net emission reductions. (EIA’s analysis assumes that current federal and state vehicle emissions standards will remain in place; however, the U.S. Environmental Protection Agency has begun steps to relax these standards.) After 2030, the sector’s CO2 emissions are projected to rebound, rising 8.2 percent by 2050, as increasing usage across modes outpaces increasing fuel efficiency of vehicles. Sales of electrified vehicles (including all-electric, plug-in hybrid, and hybrid) are projected to increase from 4 percent of market share in 2017 to 19 percent in 2050.
VMT associated with freight transportation by trucks is expected to increase almost 50 percent from 2017 to 2050 because of increased economic activity. Ton miles for freight transportation via rail are projected to increase 27 percent from 2017 to 2050 as industrial output increases.
Domestically originating air travel (domestic and international flights) is projected to double by 2050, increasing consumption of jet fuel by 64 percent despite advances in energy efficiency for aircraft. The International Civil Aviation Organization has established a global market-based-mechanism – the Carbon Offsetting and Reduction Scheme for International Aviation, or CORSIA – to achieve carbon-neutral growth in international aviation after 2020. The International Maritime Organization recently set a goal of reducing carbon emissions from international shipping 50% below 2008 levels by 2050.
 Decarbonization Opportunities and Challenges
Potential decarbonization pathways in the transportation sector include the use of lower-carbon fuels, improved vehicle efficiency, improved system-wide efficiency, and mode switching (e.g., from passenger vehicles to mass transit or from air to high-speed rail). While each of these strategies applies to some degree across all transportation modes, the primary focus here is on-road transportation, which accounts for three-quarters of the sector’s emissions
Since essentially all transportation sector emissions come from the combustion of petroleum, substitute fuels could, in theory, bring sector emissions to zero. A variety of substitutes are in use today, including ethanol, natural gas, biofuels, hydrogen, and electricity. With some exceptions, current petroleum substitutes have direct or indirect emissions, so alternate production methodologies or primary energy sources will need to be developed at scale to achieve deep reductions. The carbon benefits of alternative fuels will depend on whether they can be derived from non-emitting sources.
Electricity can potentially be used to fuel any class of road vehicle and, when coupled with decarbonization of the power sector, has the potential to deliver deep sector reductions. Electric vehicles could, in turn, contribute to decarbonization of the power sector by providing mobile storage to help integrate intermittent electricity sources like wind and solar. Challenges to full electrification include upfront costs of batteries and lack of charging infrastructure. Several countries, including the United Kingdom, China, and France, have announced bans on sales of cars and trucks that use petroleum, beginning in 2040. At the same time, major automakers like GM, Toyota, and Volvo have announced plans to electrify their entire offerings by the mid-2020s.
Hydrogen (or other) fuel cells also use electricity to drive a motor, but the electricity is generated on-board in the fuel cell, instead of being stored in a battery. Hydrogen can be generated by electrolysis of water, potentially providing a renewable fuel source, but most hydrogen used in fuel cells today is derived from natural gas. Future pathways could take advantage of surplus electricity from renewables to generate hydrogen (or ammonia, which can be more easily transported and readily converted back to hydrogen for use in fuel cells). Finding such uses for surplus renewable energy also could improve the economics of power sector decarbonization.
A critical challenge to switching to electricity (including fuel cells) is the modification, or outright replacement, of existing transportation infrastructure like gas stations. This transition could be eased by new technologies such as faster charging devices, cheaper batteries with longer range, or fuel cells that could operate on a broader variety of fuels.
Some modes, like air transportation, have unique constraints on energy density and transportability that may limit the use of electricity as an alternative. Biofuels have great potential in these cases, though only if their production does not result in deforestation or displacing crops, both of which would increase emissions from land use. Currently, most aviation biofuel is produced from used cooking oils; an alternative fuel at-scale would likely require some sort of grass- or wood-derived production. An attractive feature of many biofuels, for aviation and road transport, is their chemical similarity to petroleum refined products, which allows them to be “dropped in” to existing infrastructure.
Energy efficiency in the transportation sector takes several forms. The first is improved efficiency of conventional vehicles, aircraft, and ships through lighter materials, more efficient motors, and other design changes. These efficiency improvements can take advantage of existing infrastructure (e.g., roads, fueling stations, and ports). Indeed, most reductions that have taken place in the sector to date have relied upon these sorts of efficiencies. Electrification (including fuel cell vehicles) improves vehicle efficiency in a different way. Because electric motors are more efficient than internal-combustion engines, less overall energy is required for the same VMT.
Emissions also could be reduced through system-wide efficiency gains. Autonomous vehicles (AVs), for instance, could potentially allow higher throughput, faster speeds, fewer start-stops, and reduced congestion, dramatically reducing fuel consumption. Legal and policy frameworks to support and direct AV development are being discussed but are still in early stages.
Many other strategies could help reduce the sector’s emissions. Passenger vehicle VMT could be reduced through a number of methods. These include increased sharing of electric vehicles including AVs, land use planning that encourages compact development, and congestion pricing, which encourages car-pooling and mode switching (to walking, biking or mass transit). New, efficient modes of transport such as high-speed rail, and new technologies like magnetic levitation (e.g., Hyperloop One), could offer faster ground transportation of goods and people, potentially using non-emitting sources of electricity. Using alternative refrigerants for cooling applications, as encouraged by the Kigali Amendment to the Montreal Protocol, also could virtually eliminate HFC emissions.
Rhodium Group, Final US Emissions Numbers for 2017. https://rhg.com/research/final-us-emissions-numbers-for-2017/
U.S. Bureau of Labor Statistics, (BLS), Occupational Employment and Wages, May 2017, https://www.bls.gov/oes/current/oes530000.htm
U.S. Bureau of Transportation Statistics(BTS), Freight Facts & Figures 2017 – Chapter 5: Economic Characteristics of the Freight Transportation Industry, https://www.bts.gov/bts-publications/freight-facts-and-figures/freight-facts-figures-2017-chapter-5-economic
U.S. Department of Energy (DOE), Alternative Aviation Fuels: Overview of Challenges, Opportunities, and Next Steps, https://www.energy.gov/sites/prod/files/2017/03/f34/alternative_aviation_fuels_report.pdf
U.S. Energy Information Administration, 2018 Annual Energy Outlook with Projections to 2050, https://www.eia.gov/outlooks/aeo/
U.S. Environmental Protection Agency (EPA), DRAFT Inventory of U.S. Greenhouse Gas Emissions and Sinks 1990 – 2016, https://www.epa.gov/sites/production/files/2018-01/documents/2018_complete_report.pdf
U.S. Environmental Protection Agency, 2017, Inventory of U.S. Greenhouse Gas Emissions and Sinks: 1990–2015, https://www.epa.gov/ghgemissions/inventory-us-greenhouse-gas-emissions-and-sinks-1990-2015
U.S. Environmental Protection Agency, 2018, Light-Duty Automotive Technology, Carbon Dioxide Emissions, and Fuel Economy Trends: 1975 through 2017, https://nepis.epa.gov/Exe/ZyPDF.cgi?Dockey=P100TGDW.pdf
U.S. Environmental Protection Agency, Mid-Term Evaluation of Greenhouse Gas Emissions Standards for Model Year 2022-2025 Light-Duty Vehicles, https://www.epa.gov/regulations-emissions-vehicles-and-engines/midterm-evaluation-light-duty-vehicle-greenhouse-gas
U.S. Federal Highway Administration (FHWA), Highway Statistics 2016 Table 4.2.1 “Public Road Mileage and VMT, 1920 – 2016, https://www.fhwa.dot.gov/policyinformation/statistics/2016/