Main Greenhouse Gases

At-a-glance

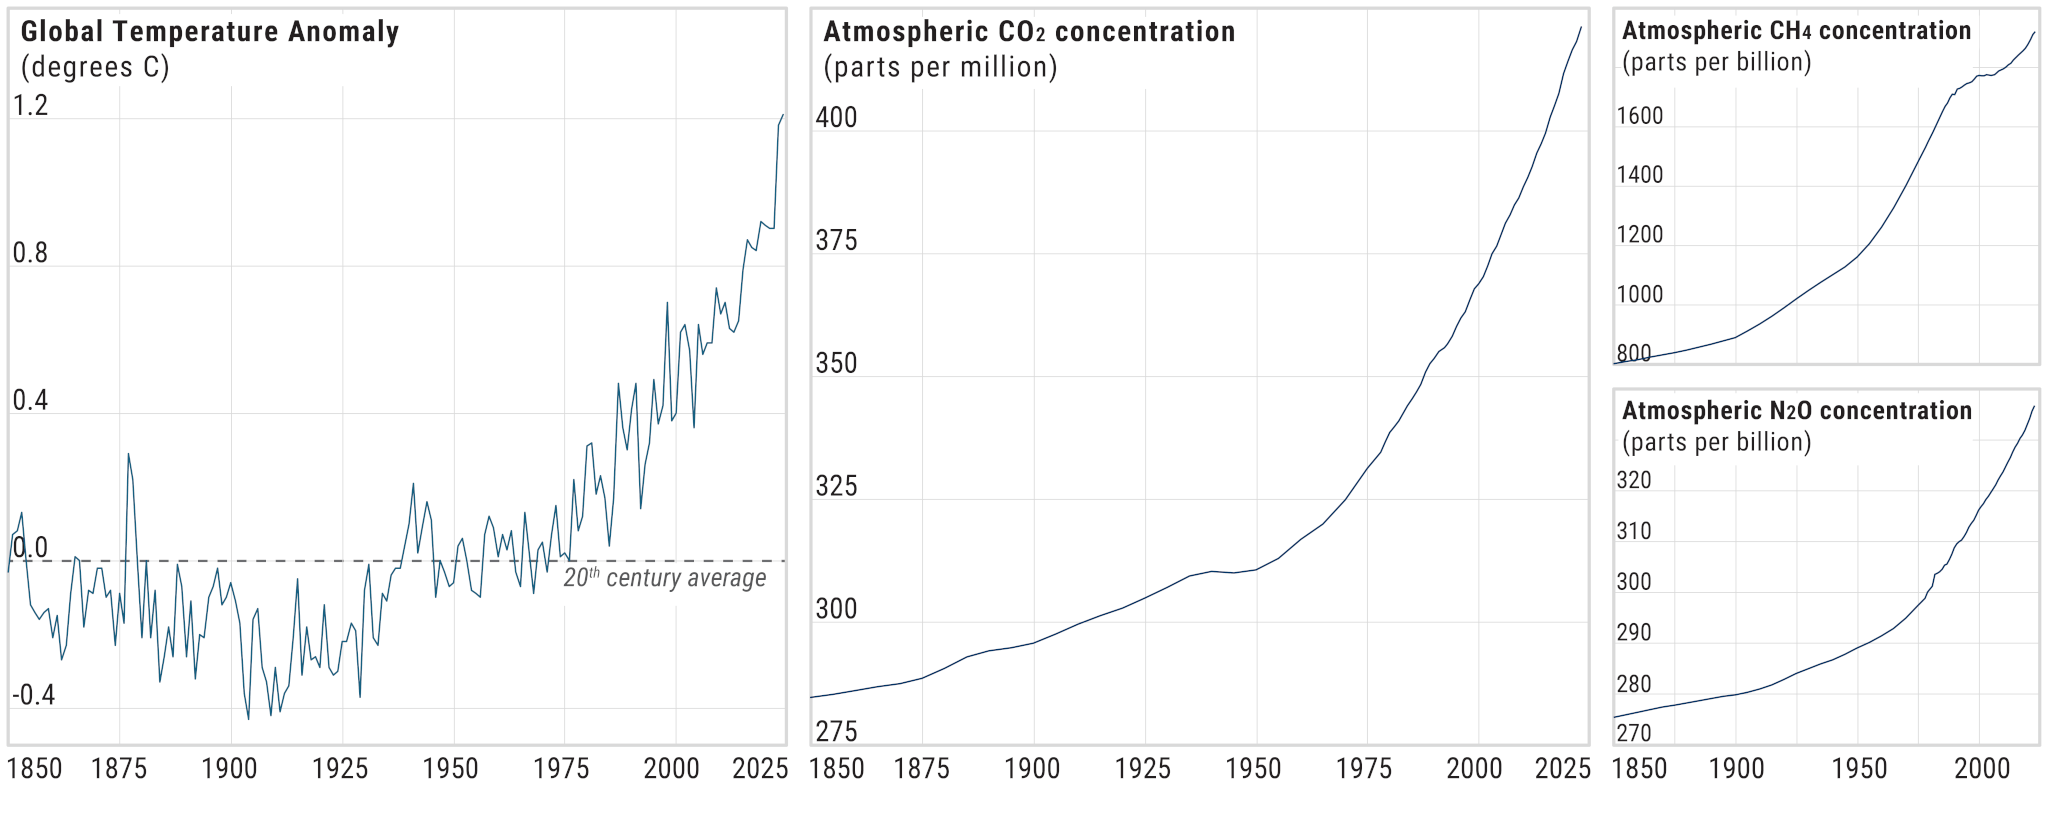
Greenhouse gases are molecules in our atmosphere that absorb heat radiating from Earth’s surface, preventing it from being emitted into space. The most common greenhouse gases are (in order of atmospheric concentration) water vapor (H2O), carbon dioxide (CO2), methane (CH4), nitrous oxide (N2O), and a suite of halogen-bearing gases (like fluorocarbons) that are derived from industrial activities. With the exception of water vapor, industrial processes and land use changes have significantly increased the total volume of greenhouse gases in the atmosphere over the past one and a half centuries, leading to a more than 1 degree C (2 degrees F) increase in average global temperature since the pre-industrial era. The relative impact of each type of greenhouse gas is a function of its concentration, its ability to absorb and radiate energy, and the length of time it remains in the atmosphere.

Greenhouse Gases

Earth’s atmosphere is composed almost entirely of the gases nitrogen (78%) and oxygen (21%), but several gases that exist in trace amounts—concentrations of less than a fraction of a percent—have an outsize impact on Earth’s climate. These are greenhouse gases—gases that allow solar radiation to pass through the atmosphere and warm the Earth, but that absorb the heat that the Earth radiates back to space, trapping it like a comforter traps body heat to keep us warm on a cold night. Small changes in the atmospheric concentration of these gases (for example going from 0.02% to 0.2% of the atmosphere) can lead to big changes in Earth’s temperature and climate, making the difference between ice ages, when mastodons roamed the Earth, and the sweltering heat in which the dinosaurs lived.

How Impactful are Different Greenhouse Gases?

Carbon dioxide (CO2) is the most abundant greenhouse gas. Each year, hundreds to thousands of times more CO2 is emitted into the atmosphere by human activity than any other greenhouse gas. However, other gases like methane, nitrous oxide, and halogenated compounds (industrial-derived gases that contain fluorine, chlorine, or bromine) have an outsize greenhouse effect relative to their concentration because of two critical characteristics: their radiative efficiency and their atmospheric residence time.

Radiative efficiency is a greenhouse gas’s ability to absorb energy and radiate it back to Earth. Atmospheric lifetime is a measure of how long a gas stays in the atmosphere before natural processes remove it (e.g., through breakdown via chemical reactions, or cycling into the ocean or biosphere).

In order to compare the relative impact of different greenhouse gases, these characteristics are incorporated into a measurement called the Global Warming Potential (GWP). GWP is a measure of the radiative efficiency of each unit of gas (by mass) over a specified period of time, expressed relative to the radiative efficiency of carbon dioxide (CO2). GWP is often calculated over 100 years, though it can be done for any time period. Gases with GWPs greater than one will warm the Earth more than an equal amount of CO2 over the same period, and the higher the GWP, the greater the warming influence. A gas with a long lifetime, but relatively low radiative efficiency, might exert more warming influence than a gas that has a comparatively high radiative efficiency but leaves the atmosphere faster than the time window of interest. This is reflected in a higher GWP in the long-lived, low radiative efficiency gas.

The table below presents atmospheric lifetime and GWP values for the three most significant greenhouse gases and select examples of halogenated compounds (of which there are more than one hundred) from the Sixth IPCC Assessment Report (AR6) released in 2021. These values are periodically updated by the scientific community as new research refines estimates of radiative properties and atmospheric removal mechanisms (sinks) for each gas.

Notes

*Carbon dioxide is quite stable in Earth’s atmosphere, but individual carbon dioxide molecules are in near-constant flux to and from different reservoirs, such as the surface ocean, land plants and animals, soils, and the lithosphere. Some of these fluxes operate on the scale of years, and others on the scale of millennia. As such, no single lifetime can be given for carbon dioxide because it moves throughout the earth’s system at differing rates. A convenient and commonly used estimate for the average CO2 atmospheric lifetime is 100 years.

SOURCE

Sixth Assessment Report (Intergovernmental Panel on Climate Change, 2021).

Greenhouse gas Chemical formula Radiative Efficiency (W/m2ppb) Atmospheric Lifetime (years) GWP (100-year time horizon)
Global Warming Potential for Major Greenhouse Gases
Carbon dioxide CO2 0.0000133 multiple* 1
Methane CH4 0.000388 12 28
Nitrous oxide N2O 0.0032 109 273
Select halogenated compounds:
Chlorofluorocarbon-12 (CFC-12) CCl2F2 0.358 102 12,500
Hydrofluorocarbon-23 (HFC-23) CHF3 0.191 228 14,600
Nitrogen trifluoride NF3 0.204 569 17,400
Sulfur hexafluoride SF6 0.567 1,000 24,300


Some gases (like CO2) are made by both natural and manmade processes, while others (like hydrofluorocarbons) are only the result of human industrial activity. The table below shows the relative concentrations of these major greenhouse gases in 1750 (well before the industrial revolution) and in 2019, and their sources. Despite carbon dioxide’s comparatively low GWP among major greenhouse gases, the large human-caused increase in its atmospheric concentration has caused the majority (about 65 percent) of global warming. Methane is similar—despite having a GWP that is also much lower than several other greenhouse gases, it accounts for about 16 percent of warming since pre-industrial times.

Notes

* CO2 is typically reported in parts per million (ppm) but is reported here in parts per billion (ppb) to provide a more direct comparison with the concentrations of other greenhouse gases.

Source

Sixth Assessment Report (Intergovernmental Panel on Climate Change, 2021), Historical GHG Emissions (ClimateWatch, World Resources Institute).

Greenhouse gas Major sources 1750 concentration (ppb) 2019 concentration (ppb) 2021 emissions rate (gigatons CO2e)
Sources and Concentrations of Major Greenhouse Gases
Carbon dioxide* Fossil fuel combustion; Deforestation; Cement production 278,300 409,900 36.69
Methane Fossil fuel production; Agriculture; Landfills 729 1,866 8.46
Nitrous oxide Fertilizer application; Fossil fuel and biomass combustion; Industrial processes 270 332 3.12
Halogenated compounds Refrigerants; Electricity transmission; Semiconductor manufacturing; Other industrial processes 0.034 1.378 1.28

The table also shows the annual emissions rate of each greenhouse gas in 2021, normalized to CO2-equivalent. CO2-equivalent (calculated by multiplying a gas’s GWP with its annual emissions by mass) provides a simple way to compare the relative climate impact of different gases and to understand the total emissions impact of human activities. Such measurements allow us to assess how much warming we might expect given current emissions trajectories, and the importance of interventions that help reduce non-CO2 greenhouse gas emissions (such as reducing fertilizer use or stopping methane leaks) as we work to minimize and mitigate climate change.