Share

Chilling out on the Polar Vortex

This week’s brief but bitter cold snap over more than half the country prompted intense discussion about the polar vortex ranging from educational to bombastic.

So let’s be clear: The cold snap this week was unusual but not entirely unprecedented. A few super-cold days don’t disprove global warming, just like a day of rain doesn’t end a drought. At the same time, we don’t yet know whether climate change will change the odds of future outbreaks of bitter cold. Research is still underway, and as of now, we shouldn’t necessarily expect these events to be more or less frequent in future winters.
Here’s a Q&A to cut through the hype:

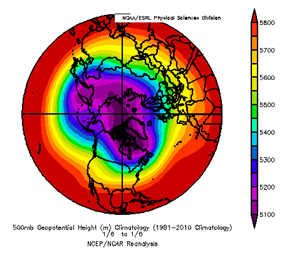
  • What is the polar vortex?  The polar vortex describes the air circulating aloft (thousands of feet above the ground) about the North Pole, and its extent is marked by a ribbon of strong winds that is often called the “jet stream.” (We most commonly focus on the North Pole, but a similar circulation is present around the South Pole, too).
    In the map (Figure 1), which is from the point of view of the North Pole, the vortex corresponds to purple and blue colored areas. The band where the colors change from blue/purple to red/yellow indicates the location of the jet stream, or the outer edge of the vortex. Winds are strongest where this color gradient is tightly packed (e.g., over the Pacific Ocean and North Atlantic Ocean). It tends to be quite cold at the surface below the purple areas, and warmer under the red/yellow areas.

It’s important to note that this figure is an average of many winter days. On any given day, we would see a number of deviations from this average pattern.

Figure 1. A depiction of the “average” polar vortex on Jan. 6. The winds of the vortex correspond to the narrow “rainbow” areas. The map is an average of the upper atmosphere’s “topography” (specifically, the 500 millibar height) from all the January 6ths between 1980 and 2010.


  • What happened this week? Comparing this week (Figure 2) to the average picture (Figure 1), we can see that the purple area of the vortex has contorted and moved farther south. Along with this pattern, there are substantial “wiggles” in the jet stream. These deviations in the circulation helped bring cold air into the continental United States that normally stays in northern Canada and the Arctic. Meteorologists look for these wiggles, called “ridges” and “troughs” (“R” and “T” on the map)  when putting together a forecast. While the trough brought notable cold to the Midwest and the East, the ridge has kept parts of the West warmer than average and relatively dry (much to the dismay of skiers).

Figure 2. The polar vortex on Jan. 6, 2014. The ridge (“R”) and trough (“T”) responsible for relatively warm weather in much of the West and bitterly cold weather in the Midwest and East have been labeled.

Although this week’s cold may be memorable, this ridge and trough pattern is far from unprecedented. See examples in Figure 3 from the winters of 1981 and 1994 when sub-zero temperatures hit a number of cities in the Midwest and East.

Figure 3. The polar vortex on Jan. 12, 1981, and Jan. 15, 1994. Ridges (“R”) and troughs (“T”) near North America have been labeled. Both days were associated with bitter cold along the East Coast.

  • How does this cold snap relate to our understanding of the climate system?  An analogy to baseball may be helpful. Imagine a hitter with a career batting average compiled over many years of playing of .333 (i.e., over his career, he has one hit for every three at-bats). If that player has an 0-for-3 day at the plate, that doesn’t mean he will never hit again. Likewise, if the hitter went 3-for-3 in a game, no one would claim that he will never strike out again. Think of one day at the plate as weather, and career batting average as climate. A few hot or cold days do not constitute a change in climate. A change in climate (i.e., a change in our long-term averages of the weather) requires decades of observations of temperature and other weather variables. These observations tell us that our planet is unequivocally warming – and that conclusion should not be obscured by anomalous events over a few days or weeks occurring in a relatively small portion of the globe.
  • What should we expect in the future?  Climate scientists are investigating how climate change may influence the ridges and troughs in the jet stream, and how it may affect future meanderings of the polar vortex that influence daily and weekly weather. If the locations or behavior of the ridges and troughs change, it would affect the frequency and intensity of hot, cold, wet, and dry extremes.

There is not yet a consensus within the climate science community regarding the impact of climate change on the “wiggles” in the jet stream. Some scientists say warming could cause large ridges and troughs to become more frequent or more persistent (see here, for example). Others consider current data inconclusive, and point to physical reasons and model simulations that support the opposite conclusion (see here and here).

Scientists continue to analyze historical data and perform experiments to better understand the physics of the atmosphere, in hopes of better answering the “what should we expect?” question. As they make progress, we will still contend with daily and weekly swings in the weather, occasionally bringing us a wintery Arctic blast.


Other resources on the polar vortex:

Author(s)